What is a Bull Flag?
A bull flag is a common technical analysis pattern that signals a brief pause in an overall uptrend. The bull flag pattern, also known as a “continuation pattern”, typically forms as a consolidation period within the context of a larger upward move.
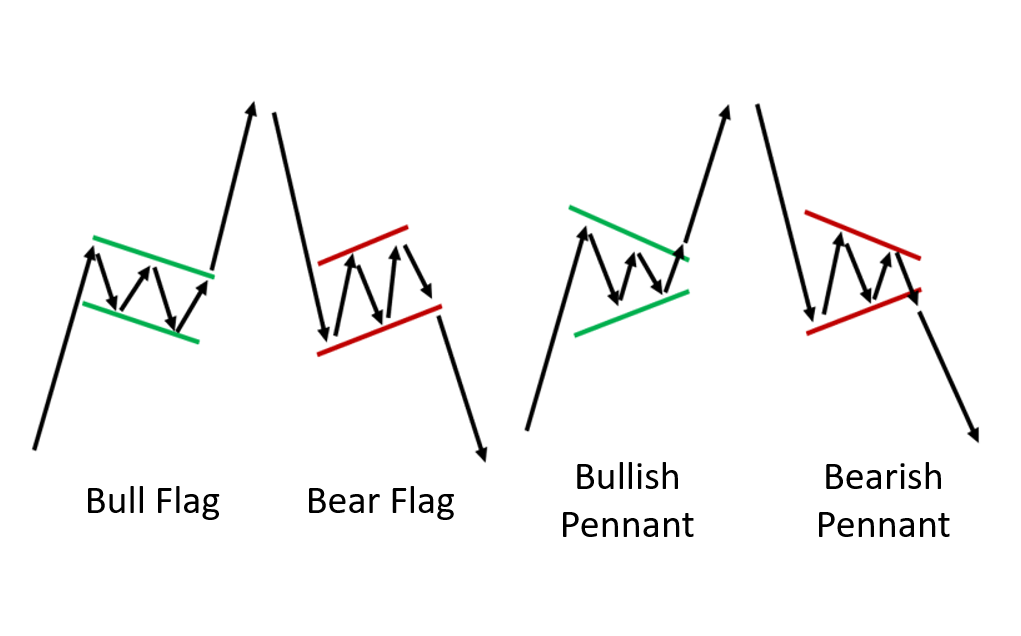
Bull flags generally have three distinct phases:
- There is an initial steep rise or surge in the price of a security. This establishes the underlying uptrend.
- After the sharp ascent, the price action enters a period of sideways consolidation where the stock moves sideways to slightly downward for a short time. During this phase, the trading volume typically decreases as buyers and sellers reach an equilibrium.
- If the bullish sentiment remains strong, the stock will break out of the flag pattern continuing the previous uptrend. The breakout usually happens on higher-than-average trading volume.
A bull flag indicates that an established uptrend is likely to resume once the temporary consolidation or “flag” is cleared. It provides traders with a potential continuation pattern to look for entry points that align with the overarching bullish trend.
What is a Bear Flag?
In contrast to a bull flag, a bear flag forms during a downtrend. It signals a brief pause or retracement within the context of an overall downward price move.
The development of a bear flag generally involves three phases:
- There is an initial steep decline or sell-off that marks the beginning of the downtrend.
- After the sharp descent, the price action enters a sideways consolidation period where the stock moves sideways to slightly upward for a short time. Volume typically decreases during this phase of equilibrium between buyers and sellers.
- If downward pressure resumes, the bear flag pattern implies that the preceding downtrend is likely to continue upon the breakout below the flag formation. Breakouts usually occur on higher than normal trading volume.
A bear flag indicates that a validated downtrend may proceed once more following the short-term consolidation represented by the flag. It can offer traders insight into potential continuation setups aligned with overarching bearish market behavior.
Key Differences Between Bull Flags and Bear Flags
The main differences between bull flags and bear flags relate to the context of the overall trend and the implications for price movement after the pattern resolves:
- Trend context – Bull flags form within an established uptrend, while bear flags occur during a downtrend.
- Implications – A bull flag signals the potential continuation of an uptrend if the pattern breaks out upward. In contrast, a bear flag implies the preceding downtrend is likely to resume on a downside breakout.
- Consolidation direction – The sideways price action in a bull flag may drift slightly downward before continuing higher. Comparatively, a bear flag could see a minor upward retracement prior to resuming the bear market.
- Volume – Breakouts from both patterns typically happen on higher than normal trading volume, as the consensus direction of the prior trend reasserts itself.
So in summary, the key differences relate to the overarching trend context, the implications for post-breakout movement, and the direction of consolidation within the flag pattern itself. Understanding these contrasting characteristics is important for traders to interpret bull and bear flags accurately.