Ever heard of the Relative Strength Index (RSI)? If you’re into crypto trading, this little gem can make a huge difference! Let’s keep it simple: RSI is an oscillator that measures the speed and change of price movements for an asset or cryptocurrency. It tells you if the asset is overbought or oversold, hinting at potential reversals or trends. RSI is a powerful tool that can give you an edge in crypto trading. It’s easy to use, and with practice, you’ll become a pro at spotting trends and making informed decisions.
How do you apply RSI to your crypto trading?
Step 1: Find the RSI Indicator
First things first, you need access to the RSI indicator. Good news is, TradeXN trading platform offers it as a standard technical tool. So, finding it won’t be a headache.
Step 2: Identify Overbought and Oversold Conditions
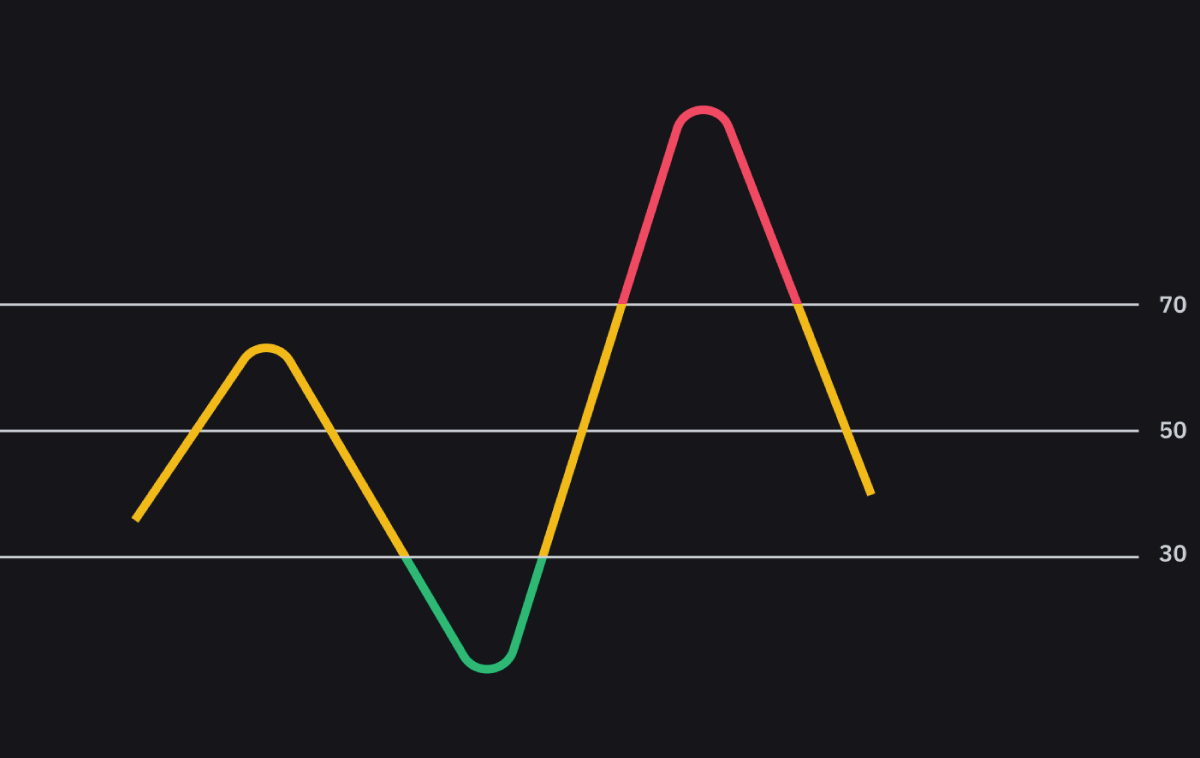
Once you have your hands on the RSI indicator, you’ll see a line on your chart fluctuating between 0 and 100. Focus on where it crosses the 30 and 70 levels. Below 30, it’s oversold (a potential buying opportunity), and above 70, it’s overbought (maybe time to sell).
The formula for RSI is as follows:
- RSI = 100 − [100/(1 + RS)]
- RS = Average Gain/Average Loss
- Average Gain = Sum of gain per period/time frame (e.g., 14)
- Average Loss = Sum of loss per period/time frame
Trading platforms offer access to RSI and compute the values automatically. Hence, you don’t need to do the calculation. Once you apply it to your trade, the RSI line graph appears below your market charts.
Step 3: Spot Potential Entry and Exit Points
Here comes the exciting part – spotting entry and exit points! When the RSI line crosses above 30, it’s a “bullish crossover,” hinting at an uptrend. Conversely, when it crosses below 70, it’s a “bearish crossover,” indicating a possible downtrend.
Step 4: Confirm with Other Indicators
While RSI is awesome, it’s always good to play it safe. Confirm your findings with other technical indicators like Moving Averages or MACD. This combo can give you even more reliable signals for your trades.
Step 5: Practice and Fine-Tune Your Strategy
Don’t rush into huge trades right away. Start small, get familiar with RSI, and build your confidence. With practice, you’ll understand how RSI behaves under different market conditions. Tweak your strategy as needed to improve your trading game. Some traders take RSI to a whole new level with Stochastic RSI, a combination of stochastic oscillator and RSI. This baby ranges from 0 to 100 and can give you even more insights.
How to use RSI divergence for better market indications?
When the price and RSI don’t agree, it could signal a trend reversal. A bullish divergence suggests upward momentum, and a bearish one may indicate a price pullback. Remember, an asset’s primary trend is crucial when interpreting RSI signals accurately. Connie Brown, a market analyst, suggests different overbought and oversold levels depending on the trend. Keeping an eye on these levels can help you avoid false signals.
Quick tip: If the RSI is above 30, it’s bullish. Below 70, it’s bearish. Simple as that!
Lastly, adjust your RSI time frame to match your trading style. Swing traders often use the default 14-period RSI, while day traders prefer shorter periods for a more sensitive indicator. If you’re into advanced techniques, try RSI swing rejections. It’s all about how RSI reacts to overbought or oversold signals and can give you more confidence in your trades.
Lastly, if you ever want to compare RSI with other indicators like MACD, remember they measure different things. RSI looks at price variations, while MACD examines the relationship between two moving averages.Understand Risk management and how you can minimize your loss while utilizing trading indicators.