Cryptocurrency traders seek efficient technical analysis indicators to predict price movements and accurately identify current trends. While some believe that complex indicators with numerous lines and elements offer better signals, this is not necessarily true. Often, the traditional approach proves more effective and straightforward. One such reliable technical indicator, used for decades and still performing well, is the Bollinger Bands.
Bollinger Bands consist of three lines forming a channel around the price action. The middle line represents a Simple Moving Average (SMA), while the upper and lower lines are derived from the SMA and adjust based on price volatility. Traders utilize Bollinger Bands to assess the prevailing trend, measure market volatility, and anticipate potential trend reversals.
What Are Bollinger Bands?
Bollinger Bands are widely used technical indicators known for their accuracy in measuring volatility. They help determine how high or low the price is relative to past closing prices. Developed by John Bollinger in the 1980s for analyzing stocks, these bands have remained popular tools for price analysis and are extensively embraced in both traditional and cryptocurrency markets.
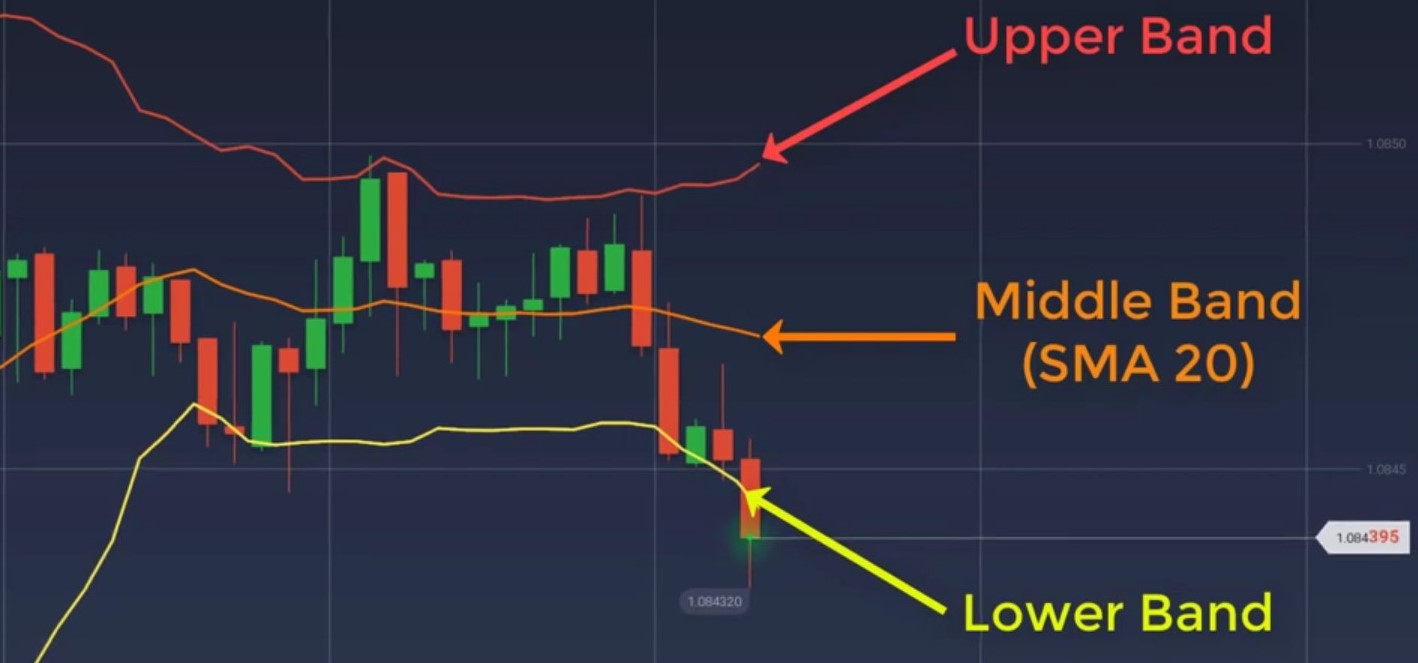
The Bollinger Bands consist of three bands:
- The Middle Band: This represents the Simple Moving Average (SMA).
- The Upper Band: Calculated by adding two standard deviations to the SMA, it measures the variation from the middle band and adjusts the upper and lower bands based on price volatility.
- The Lower Band: Derived by subtracting two standard deviations from the SMA.
These bands form two lines plotted above and below a simple moving average. By default, the indicator uses a period of 20 for the Simple Moving Average (SMA) and sets two standard deviations for each of the upper and lower lines.
Characteristics of Bollinger Bands
To effectively identify and utilize Bollinger Bands, consider the following key characteristics:
- Volatility Measurement and Trend Determination: Bollinger Bands serve as a valuable tool for measuring price volatility, while also providing insights into the prevailing trend and identifying overbought and oversold levels.
- Three-Line Structure: The indicator is composed of three lines – a 20-period Simple Moving Average (SMA) and upper and lower lines. These lines are set with two standard deviations by default.
- Dynamic Bandwidth: Bollinger Bands automatically expand when market volatility increases and contract when the market becomes less volatile.
- Mean Reversion: Prices often revert towards the middle of the bands. When the price touches one of the bands, it tends to bounce back towards the opposite side. This characteristic makes Bollinger Bands a valuable indicator for swing traders.
- Potential Breakouts: If the bands remain close to each other for an extended period, a breakout may occur in either direction, signifying a potential trend shift.
Why are Bollinger Bands Important in Crypto Trading?
As you are aware, cryptocurrencies are known for their inherent volatility. Being relatively new compared to traditional assets, digital currencies tend to respond rapidly and sharply to market events and significant transactions. Therefore, having a technical indicator that takes volatility into account becomes crucial for crypto traders to effectively analyze price action and make informed decisions.
Trading extremely volatile assets, particularly for newcomers, can be challenging and risky. To manage these risks, employing indicators like Bollinger Bands can assist traders in identifying more accurate entry and exit points for their trades.
How to Utilize Bollinger Bands in Crypto Trading?
Using Bollinger Bands in cryptocurrency trading follows the same principles as using them in traditional asset trading, such as forex pairs or company shares. However, you can expect greater volatility in digital assets, leading to increased trading opportunities and signals from this particular indicator.
Depending on your trading style, you can set up the Bollinger Bands as follows:
- Short-term (Day Trading): Set the Simple Moving Average with a period of 10 and bands at 1.5 standard deviations.
- Medium-term (Swing Trading): Utilize the default parameters, which include a 20-day Simple Moving Average and bands at 2 standard deviations.
- Long-term (Position Trading): Use a 50-day Simple Moving Average and bands at 2.5 standard deviations.
As a general rule, when the bands contract during periods of low volatility, you should anticipate a breakout in either direction. However, it is understandable to wait for confirmation that the breakout leads to a new trend. This cautious approach helps avoid potential isolated spikes or slumps. This concept aligns with the Bollinger Squeeze strategy, which proves effective in trading digital currencies.