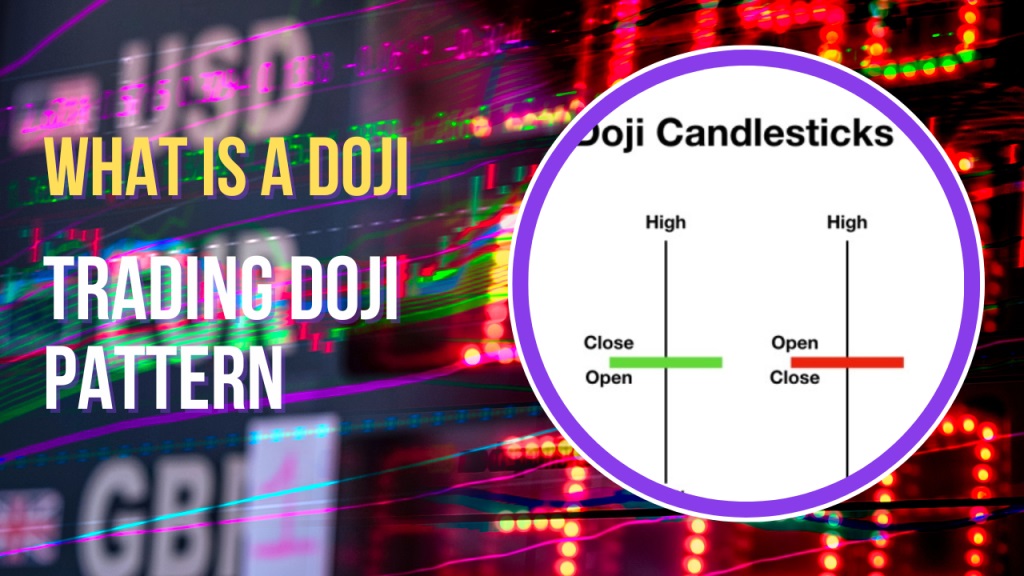
How do you read a Doji candlestick?
A Doji candlestick occurs when the opening and closing price are virtually equal, forming a small body that gaps the high and low prices for the period. This indicates that buyers and sellers are in a state of equilibrium and that control of the market is uncertain. The small or absent body shows indecision in the market.
Is a Doji Candlestick bullish or bearish?
On its own, a Doji candlestick is neither inherently bullish nor bearish. It is important to consider the context and what came before it. A Doji after an uptrend could signal hesitation or exhaustion in the upward move. This makes it potentially bearish. Conversely, a Doji after a downtrend could signal a pause in the downward selling pressure and a potential trend reversal. This makes it potentially bullish.
How do you read a Doji Candlestick?
When analyzing a Doji, it is important to look at the context and what came before it.
Was the market trending up or down leading into the Doji? A Doji at the top of an uptrend may signal a reversal down. A Doji at the bottom of a downtrend may signal a reversal up. It is also important to look for confirmation on the next candle. A bullish Doji would look to see a strong green candle the next day confirming the reversal. A bearish Doji would look for a strong red candle the next day.
Is the price moving higher overall in an uptrend? If the market has been trending higher and you see a Doji candlestick form after a run up, this could indicate hesitation, exhaustion or a potential reversal lower. Look for confirmation on the next candle. A strong red candle the next day would confirm the Doji as bearish. However, a small real body green candle could mean the uptrend is still intact with just a pause. It would take further candles to confirm if the trend has truly reversed.
Is the price moving lower within an overall uptrend (known as a pullback)?
Within an overall uptrend, occasional pullbacks are normal and healthy for the trend to continue. A Doji during a pullback phase actually indicates the selling pressure may be easing. As long as the next candle is still green and the lows of the pullback are held, it keeps the trend intact. In this context, a Doji during a pullback would not be seen as reversal signal but rather a pause or consolidation before the uptrend resumes its move higher.
Is the price in a downtrend?
If the market has been trending lower and you see a Doji candlestick form after a decline, it indicates indecision between buyers and sellers after a run down. This could potentially signal a reversal bottom is being put in place. Look for confirmation on the next candle. A strong green candle the next day would confirm the Doji as bullish reversal signal. However, further red candles could mean the downtrend is still intact.
Is the price in a pullback within an overall downtrend?
Within a downtrend, brief periods of upside correction or consolidation (known as pullbacks) are normal. A Doji during such a pullback phase actually signals the buying pressure may be increasing as the bears take a breather. As long as the next candle is still red and the highs of the pullback are not surpassed, it keeps the downtrend intact. In this context, a Doji during a pullback would not be seen as a reversal signal but rather a pause before the downtrend resumes.
What is the 3 candle rule in trading?
The 3 candle rule is a guideline used when trading Doji candlestick patterns. It states that for a Doji signal to be considered valid, it should be followed by 2 more candles continuing the direction of the presumed reversal. For example, if a Doji forms at the bottom of a downtrend, the 3 candle rule looks for a strong green candle the next day, followed by 2 more green candles to confirm the bullish reversal. This adds confirmation to the Doji signal and filters out false signals. On the TradeXN trading platform, traders can set alerts based on Doji candle patterns and then only enter a trade if the 3 candle rule is satisfied. This helps improve the odds of a successful trade.
Doji candlesticks can provide valuable signals about potential reversals and changes in market momentum when supported by context and confirmation. The TradeXN platform empowers traders to easily spot Doji patterns, set alerts and only enter positions when the 3 candle rule is met. This systematic approach, when combined with technical analysis, can help traders identify high probability trading opportunities amidst the noise and fluctuations of the markets on a daily basis. Doji candlesticks are one tool in the toolbox, but an important one nonetheless for any trader looking to refine their strategy and gain an edge.
Advanced Doji Candlestick Pattern Analysis
Beyond the basic Doji candlestick, there are several more advanced pattern variations that provide additional insight into market dynamics:
- Gravestone Doji: This occurs when the opening and closing price are equal and at the lows of the trading session. It indicates strong selling pressure and no buying interest, signaling a potential top reversal.
- Dragonfly Doji: Formed when the opening and closing prices are equal and at the highs of the session. It shows buying interest overwhelmed selling pressure, potentially signaling a bottom reversal.
- Long-legged Doji: Has very long upper and lower shadows, indicating a large range between the high and low prices. It shows strong indecision and battle between buyers and sellers throughout the period. Needs confirmation of direction on subsequent candles.
- Spinning Top Doji: Has a small real body, but upper and lower shadows are kept relatively short compared to range. Still signals indecision, but within a narrower price range than a regular Doji.
- Three River Morning Star/Evening Star: A three candle reversal pattern where a down gap, small real body Doji, then an up/down gap confirms the reversal. The Doji session shows the balance point between the trend and the new direction.
Combining Doji Patterns Traders can also look for combinations of Doji patterns over multiple time frames to strengthen signals. For example, spotting a Gravestone Doji on the daily chart, supported by a Dragonfly Doji on the 4 hour chart increases confidence in an impending reversal. The TradeXN platform allows setting alerts across different time frames simultaneously.
Incorporating Indicators Doji analysis also benefits from combining with technical indicators: RSI, MACD and Bollinger Bands. Divergences between Doji signals and indicators help filter out false signals. For instance, a Doji forming at the top of an extended rally where RSI is not in overbought territory reduces the chances of an immediate trend reversal. The TradeXN platform seamlessly integrates popular indicators for enhanced pattern recognition.
Risk Management with Doji Candlestick Trading
While Doji candlesticks can provide valuable trading opportunities, it is crucial traders implement strict risk management practices to avoid potential pitfalls:
- Use Stop Losses: Set stop losses beyond logical support/resistance levels to limit losses from whipsaws against the expected direction. The TradeXN platform allows trailing stops to lock in profits during trends.
- Confirmation is Key: Only enter positions if subsequent candles satisfy confirmation rules like the 3 candle pattern. Lack of confirmation means the signal is invalid.
- Beware of Fakeouts: Since Dojis show indecision, the market can easily move briefly against the expected reversal before resuming the prior trend. Only enter if subsequent price action strengthens the pattern.
- Be Selective of Time Frame: Higher time frame Doji signals like daily and weekly charts are more reliable than rushing to trade every small Doji on lower frames which generate more noise.
- Consider Market Conditions: Dojis work best in trending markets rather than periods of high volatility and choppiness. Avoid chasing signals in sideways, ranging markets.
- Use Proper Position Sizing: Limit risk exposure by trading smaller position sizes until a pattern proves reliable. Scale in, not all at once on the signal candle.
- Continually Evaluate Performance: Keep detailed trading journals and objectively assess which Doji patterns are winners over time versus those resulting in losses. Drop unreliable patterns from the strategy.
With a robust risk management framework and selective approach, Doji candlestick analysis can provide a powerful tool for discerning potential reversals and changes in market momentum. When combined with confirmation rules, indicators and selective timing on the TradeXN platform, it has the potential to give traders an edge in navigating volatile markets.