Along with day trading and position trading, swing trading is one of the most popular types of trading. Since it is less frantic and stressful than day trading but still allows traders to profit from price changes, this trading method is less scary for newcomers.
For frequent use of swing trading indicators, it is crucial to recognize support and resistance levels when the trend shifts, creating trading opportunities. A single technical indicator could occasionally be erroneous, necessitating further confirmation; hence, it is known to employ numerous indicators to validate a trend before placing a trade. Swing trading in cryptocurrencies will be discussed in this post, along with some of the top technical indicators you may use to get started.
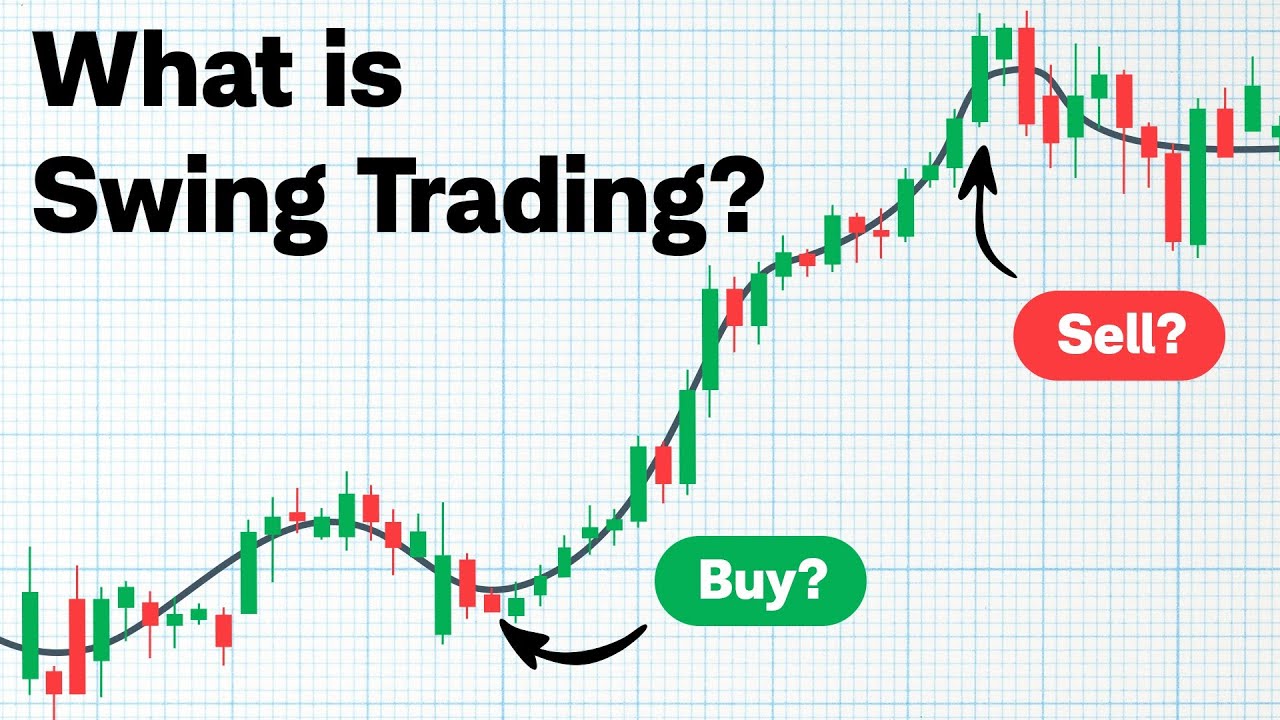
Understand Swing Trading
In order to grow when the market swings in the anticipated direction, a swing trader opens a position based on their expectations for price movements. Positions in swing trading are typically held overnight and may remain open for several days or weeks.
The foundation of swing trading is the idea that price retracement occurs frequently in the cryptocurrency market. A swing is an increase or decrease in price. These variations are used by swing traders to enter trade positions and make money. Even while some swings may be lesser in size, translating to a smaller reward, a swing trader can eventually make and amass a sizable profit as long as they are consistent in how they execute their trade. Swing traders frequently utilize technical indicators to determine the best times to enter and leave their holdings.
Swing trading is a popular trading strategy that plots a number of standard deviations around a moving average using the Bollinger Bands indicator. However, some traders prefer the average true range indicator to measure volatility in the cryptocurrency market. In either case, combining various swing trading indicators is crucial to comprehending and forecasting the price movements of cryptocurrencies for better decision-making.
Let’s look at an outline of a swing trade before discussing the finest technical indicators for swing trading.
When swing trading, as long as the trend continues in the direction you anticipate, you can hold your position open for several days or even weeks. When the trend begins to reverse, traders typically decide to close their position. Compared to day traders, swing traders are less interested in short-term price volatility because they trade over longer time periods. Swing highs and swing lows are the only things that count for swing traders in a bullish market and a bearish one, respectively.
Move High
Swing highs are peaks that a cryptocurrency’s price touches repeatedly before a brief period of retracement. The trend can sometimes reverse during a retracement, breaking the series of swing highs. When the current high exceeds the previous peaks, an uptrend is present.
Move Low
Swing lows are subsequent lows that are produced following brief rebounds. We can identify a usually negative trend when the most recent low is lower than the ones that came before it. A shorter-term variation of swing trading is when some swing traders simply trade between swing highs and lows.
Swing Trading Tools
On the basis of historical data, swing trading indicators utilize mathematical computations to determine various characteristics of a price action. They can be utilized on a daily chart or with any other time frames that swing traders employ to evaluate the state of the market. These indicators aid traders in determining a trend’s momentum and whether it is bullish or negative. Technical indicators are essential for choosing the optimal entry and exit opportunities, even though some swing traders place a greater emphasis on news and fundamental analysis.
The following are the top three categories of swing trading indicators:
- Trend indicators: These show the market’s movement and if a trend is likely to develop. Typically, price volatility is smoothed down using trend indicators to emphasize the main trend. The most well-known trend indicators are moving averages.
- Momentum indicators—Momentum indicators demonstrate the strength of a trend and whether a reversal may be imminent. Additionally, they might signal overbought or oversold levels. The relative strength index (RSI) is the momentum indicator that is most frequently utilized.
- Volume indicators show the number of traders who are buying and selling an asset at any given time.
Most Effective Swing Trading Indicators
We’ll discuss some of the top swing trading indicators in this section. It should be emphasized that it’s virtually hard to guarantee earnings regardless of the indicators employed. This is due to the fact that technical indicators use historical data to forecast the future, and there will always be some discrepancies that will provide different results.
The top six technical indicators for swing trading are listed below.
- RSI/relative strength index
One of the most crucial indicators for trading cryptocurrencies is the Technical Indicator: RSI. It might also be listed in the “oscillators” category. It determines the breadth and depth of the most recent price fluctuations. Swing traders primarily use the RSI indicator to spot overbought or oversold levels of a cryptocurrency.
The RSI indicator is shown as an oscillator, which is a line graph that alternates between two extremes and ranges from 0 to 100.
The RSI indicator often suggests that a particular cryptocurrency is in overbought zone when it rises above 70, indicating the possibility of an uptrend reversal. On the other side, if the RSI falls below 30, it means that the market is oversold and that the bearish trend may be about to halt. Searching for center line crossovers is another approach to make advantage of the RSI. For instance, the RSI indicator signals a rising trend when it crosses over its center line.
- Moving Average (MA)
Moving average is frequently employed in conventional financial markets for technical analysis of commodities and stock prices. Swing traders utilize MA, as its name implies, to determine the average price movement of an asset over a specific time period. As a result, MAs obfuscate possible trends by reducing short-term volatility, which may appear perplexing to traders.
It’s critical to realize that MAs are lagging indicators that depend on previous price activity. So it’s beneficial to utilize them to support a trend rather than forecast potential course changes.
Depending on how many periods they monitor, short, medium, and long-term MAs can be distinguished. For instance, medium-term MAs cover up to 100 lookback periods, while short-term MAs cover between 5 and 50.
- Simple moving averages (SMAs) and exponential moving averages (EMAs) are the two primary categories of MAs. The latter places more emphasis on more recent price movement by giving it more weight.
- A shorter-term MA crossing over a longer-term MA typically establishes a bullish signal, and vice versa: When a longer-term MA crossing below a short-term MA, be wary of a potential downturn.
- MACD, or Moving Average Convergence Divergence
The more intricate technical indicator known as moving average convergence divergence (MACD) combines two standard moving averages. The 26-period EMA and the 12-period EMA are subtracted to calculate MACD, though you can manually change these settings to suit your needs. The two lines shown on a MACD chart do not correspond to the two MAs utilized in the computations, to be clear. Instead, the three components of the MACD indicator are as follows:
The MACD line measures the separation between two specified MAs.
- The signal line is used as a trigger for bullish and bearish signals because it can detect changes in price momentum.
- The histogram, which shows how the MACD line and the signal line diverge,
- The green circles in the above graph illustrate where the MACD line crosses above its signal line, where swing traders typically buy, and the red circles show where they typically sell.
Looking for divergence between the histogram and the price action, which typically heralds a trend reversal, is another approach to use the MACD.
- Quantity
Despite the fact that novice swing traders sometimes neglect it, volume is one of the most important indicators. This indication may automatically be displayed beneath the main chart. It provides information on how strong a recently developed trend is. The volume indicator essentially shows us the number of traders who are purchasing or selling a cryptocurrency or asset at a particular time. Therefore, the trend is stronger the higher the volume.
Volume is particularly helpful when using breakout methods, which are used when an asset’s price crosses a resistance or support line. If there is a lot of volume with the breakout, the new trend is likely to be significant.
- Bollinger Bands
A moving average and two (positive and negative) standard deviations make up the three lines that make up the Technical Indicator: Bollinger Bands, a momentum indicator. This indicator is favored by swing traders because it recognizes trends, overbought and oversold levels, and volatility fast. Additionally, the chart makes everything look pleasant and straightforward.
When the market is experiencing reduced levels of volatility, the breadth of the BB decreases along with the volatility. Simply explained, the volatility decreases as the bands become closer to one another.
While BB performs admirably in trending markets, they excel even more when the price is ranging, or rising and falling inside a horizontal channel. Swing traders may enter a short position in this scenario when the price reaches the upper line. When the price reaches the indicator’s lower line, a rebound can follow.
The key idea is that the pricing will constantly veer toward the BB’s center. Trading within that band should be avoided if the space between the bands begins to widen, which indicates the emergence of a new trend.
- Stochastic Oscillator
Another momentum indicator is the stochastic oscillator. Although its calculations are different from those of the RSI indicator, it functions similarly. This indicator evaluates an asset’s closing price in relation to the price distribution over a specified time period.
- The stochastic oscillator, like the RSI, is displayed as a chart with a range of zero to one hundred. Overbought and oversold zones, however, are, respectively, above 80 and below 20.
- Another distinction is that the stochastic has two lines, as opposed to the RSI’s single line. A three-day MA appears on one line, while the other line displays the current value.
Traders use the stochastic to identify overbought and oversold levels. They also keep an eye out for the two lines to cross, which typically signals a change in trend.
The Best Swing Trading Tools
When it comes to sending out pertinent signals, the trading indicators discussed above can be excellent tools, but they become much more effective when used in tandem with other charting tools. Here are a few ideas:
Lines of Support and Resistance
Swing traders should constantly be aware of support and resistance levels that a cryptocurrency’s price has a hard time breaking.
A resistance level is, in essence, an idealized upper line that a price cannot cross (typically falling when it touches the resistance). A price often stops falling and begins to rise at a support level, which is an imaginary line constructed of recent lows.
Chart Symbols
Swing traders can also search for patterns on charts, which are typically seen on candlestick charts. Patterns fall into two primary categories:
Triangles, rectangles, flags, and pennants are a few examples of patterns that predict the continuation of a trend. Patterns that indicate a trend is about to change include double tops or bottoms and head and shoulders
Final Reflections
Swing trading may be the best trading strategy for new traders, and you can take advantage of market volatility by using trading indicators. Swing trading involves inactive price movements, but you shouldn’t disregard fundamental risk control strategies. You can stop your balance from being lost by using a stop loss.
Trading indicators could not live up to traders’ hopes. Technical indicators were created to assist you in making better decisions based on in-depth market knowledge and past performance, not to accurately predict future price movements.